How the Pluto maps were made
The challenge
 Pluto is a long way from both the Sun and the Earth. Its great distance
from the Sun means it is a very cold place. Its
distance from the Earth means it appears to be very, very small and you need
a very powerful camera to see any detail at all. This challenge is so severe
that there are no cameras or telescopes in existence on the surface of the
Earth that can resolve the disk of Pluto in visible light. The very biggest
telescopes on the planet (like the Keck telescope in Hawaii) can resolve
surface detail but only in the infrared. That's useful, but, cannot tell
us what Pluto would look like to the naked eye. The only tool we have that
is up to this task is the the Hubble
Space Telescope.
Pluto is a long way from both the Sun and the Earth. Its great distance
from the Sun means it is a very cold place. Its
distance from the Earth means it appears to be very, very small and you need
a very powerful camera to see any detail at all. This challenge is so severe
that there are no cameras or telescopes in existence on the surface of the
Earth that can resolve the disk of Pluto in visible light. The very biggest
telescopes on the planet (like the Keck telescope in Hawaii) can resolve
surface detail but only in the infrared. That's useful, but, cannot tell
us what Pluto would look like to the naked eye. The only tool we have that
is up to this task is the the Hubble
Space Telescope.
There have been two cameras onboard HST that can resolve Pluto and
both are no longer in service. In 1994, Alan Stern and I used the
Faint Object Camera to take 4 shots of Pluto from which we created the
first maps from direct imaging. In March 2002, astronauts installed a
new camera called the Advanced Camera for Surveys (ACS). This then new
camera had one operating mode called the High-Resolution Camera (HRC).
The maps release on Feb. 4, 2010 are the result of using the ACS/HRC
system to take the most detailed set of observations ever made of Pluto.
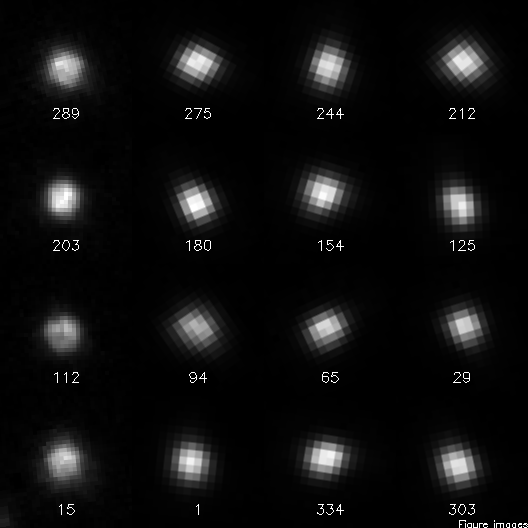
The picture to the right shows a sample of the raw images as they were
directly taken by Hubble. In this picture, the left-most column shows
the 4 views from 1994 taken with FOC. The other three columns on the right
show the 12 views obtained with ACS/HRC. The numbers indicate the longitude
of Pluto that was being imaged at the time.
One thing you may note right away from these images is that Pluto is far
from being clear and easy to see, even with Hubble. The raw images with
FOC don't look too bad but the newer ACS images are even harder to figure out.
That's where a good observing strategy and lots of computers come into play.
The technique
You can read more about the basics of turning images into maps in a
write up I did in 1996. Processing the ACS
data was considerably more difficult. The pixels are larger compared to
Pluto and the images are badly distorted from the lenses used in the camera.
The basic method, however, is the same. First, you start with a guess for
Pluto's map. From this map you project it onto a sphere for the hemisphere
of Pluto in each image. Next, you distort the image in the same way that
the camera optics distorts the scene and then finally stuff the picture down
into the large blocky pixels. When you do this you can then compare your
guess against the images. Of course, your first guess won't match the data
very well so the trick is to tweak the map, a little darker here, a little
brighter there, and try again. You do this over and over until your map
creates synthetic images that match the real images.
Sounds simple, right? Well, probably not but this isn't the hard part.
For the FOC data, this technique is very simple because the images are not
distorted and the camera's pixels are small. On a typical computer of the
day you can find the best map in a matter of minutes. The ACS data were
another story completely. Since the pixels are so big by comparison I had
to take lots of pictures in rapid succesion while shifting the telescope
a small (and different) amount between each image. This is a process known
as "dithering" and can be used to make up for having pixels that are too
big. In this case, everytime we observed Pluto we took 16 dithered images
in each of two filters. All together there are 384 images of Pluto that
had to be processed to create the map.
Here's where it gets hard. This process of trial-and-error solving for
the map of Pluto requires a lot of computing time. Taking the map and
computing what one image must look like took about 5 seconds on
a circa 2004 computer (AMD 2500+). That may not sound so bad but when you
add it up for all 384 images it takes about 30 minutes to test one guess
for the map. Once I had the software working my estimate was that I would
need 20 years on one computer to get to an answer! Clearly I needed a better
tool.
The tools
I really wanted get an answer out in a reasonably short time. One way is
to just use a faster computer (or wait for someone to build a faster
computer). I checked around and quickly found that wasn't really an option.
By spending a lot of money I might be able to get something a factor of 2 or
3 faster and I didn't have a lot of money. There is another computing
technique people use called parallel processing where you dedicate a lot of
computers to one task. I wondered how many computers I might be able to
get for this task. In the end I was able to put together a complete computer
for $450. This was a small box made by Shuttle that needed a processor
(AMD 2500), memory (512Mb), and a system disk (20Gb). The box already
included the mainboard with video and network ports. There was no need for
a keyboard or monitor. I got really good at putting these things together.
It was not enough to just have a bank of computers. I needed a way
for all of them to work together on my problem. Nothing available could
tackle my problem so I had to invent a new method. With the help of a
great programmer, Doug Loucks, we came up with the following scheme.
There is one computer running a program that's tweaking the map in
search for the best fitting answer. We call this program the master.
The master is the one that knows what it wants to do, making all the
decisions. Each time it wants to try a new map it then needs someone
to compute all the images based on that map. What it does is setup one
independent task for each image. These tasks can be carried out by as
many computers as you have available. The little computers I built are
all called workers and are there to grind through these task as fast
as possible and send their answers back to the master. You can
imagine that keeping track of all of this is a bit of a challenge.
We already have the master and the worker. We then had to invent the
foreman. This is the program that listens to the master to get a list of
tasks and then hands off these tasks to any worker that isn't alrady busy.
the amazing thing about this scheme is that the foreman and worker don't
really know what they are doing other than just running one task after
another. It's the master that pulls it all together and produces the
final answer. As you might imagine there were a lot of details to iron
out to get everything working just right. Some of those details were
a complete surprise.
To this day I don't know exactly why, but it turns out that every once
in a while, any given computer could generate an incorrect calculation.
I had to figure out a scheme to detect these bad calculations and
redo it. Along the way I found that even though I had all of these
seemingly identical computers, they weren't the same. Some never made
bad calculations and some would do something wrong every two weeks or so.
Also, once it made a bad calculation, the offending machine would get
rapidly worse until it needed to be power cycled. Some of you may have
heard of the trick of "over-clocking" a processor to get more speed from
a computer. This is a well known trick in the gaming community and they
also know that if you push it too far the computer doesn't work anymore.
I found that some of the machines needed to be "under-clocked", that is,
run slower than its nominal speed. Once I figured this out I was able
to keep all the computers running indefinitely. In fact, after about
six months of working with the software and computers we had that system
running so well that the only time it was down was when the commerical
power would fail.

Back to my home page -o-
Back to my Pluto page
Marc W. Buie, Southwest Research Institute