APPENDIX C
DETAILS OF THE THERMOPHYSICAL MODELS
This appendix describes the numerical thermal models used in Chapter 7
to match the observed diurnal temperature distributions on the Galilean
satellites, and also the cooling and heating behavior during eclipse by
Jupiter. The diurnal models are described first.
Diurnal Thermal Models
Numerical models of diurnal conductive heat flow have been used to determine
planetary surface temperatures for many years. They have been applied to
such tasks as the radiometric determination of asteroid and satellite diameters
(Lebofsky et al, 1986), determination of rock abundance on Mars
(Christensen 1986), and water ice stability on the Galilean satellites
(Squyres, 1980). My model is similar to most others but differs in detail,
and I describe it here for completeness.
The model obtains the temperature T as a function of depth below
the surface x and time t by numerically solving the one-dimensional
conductive heat flow equation
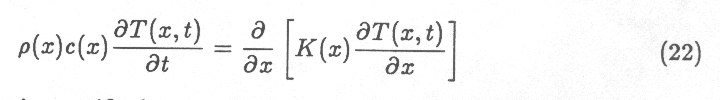 where $\rho$ is density,
c
is specific heat capacity, and K is thermal conductivity. $\rho$,
c,
and K may vary with depth, but at Galilean satellite temperatures
they do not vary significantly with temperature. The equation is evaluated
over the x interval from 0, at the surface, to some depth d.
where $\rho$ is density,
c
is specific heat capacity, and K is thermal conductivity. $\rho$,
c,
and K may vary with depth, but at Galilean satellite temperatures
they do not vary significantly with temperature. The equation is evaluated
over the x interval from 0, at the surface, to some depth d.
Upper and Lower Boundary Conditions
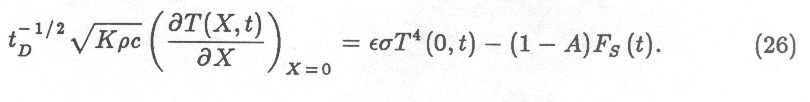
The boundary condition at the surface is
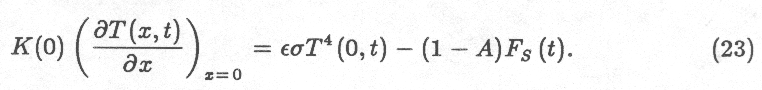
which represents the balance between the conductive heat flux from
below, on the left-hand side of the equation, and the thermal radiation
(first term on the right hand side: \ep\ is the emissivity and $\sigma$
is the Stefan-Boltzmann constant) and absorbed sunlight (second term on
the right: A is the bolometric albedo and FS the
time-dependent flux of sunlight). I ignore the possible variation of A
with solar incidence angle (Squyres and Veverka, 1982), and also the possible
subsurface penetration of sunlight (Brown and Matson, 1987).
The boundary condition at the base of the x interval is that
there should be no heat flux through the boundary, i.e.
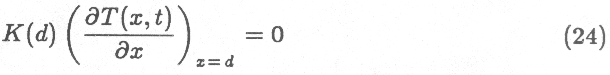
which implies no spatial temperature gradient at the lower boundary
and therefore, from Equation 22, no temperature change with time there
either. The constant temperature condition is achieved by having the lower
boundary deep enough that it is below the diurnal temperature variations,
which decay exponentially downwards with characteristic `skindepth' s=\sqrt{(K
t_D) / (\rho c)}$, where tD here is the length of a day.
I generally used d=3.2 for homogeneous surface models.
I chose the `deep temperature' T(d,t) by using the fact that
for c and K independent of T, the `true' deep temperature
(the value for which there is no heat flow through the base of the model)
is equal to the diurnally-averaged surface temperature. I ran every model
twice, first with an estimated deep temperature and second with a deep
temperature equal to the mean surface temperature from the first run, with
a correction factor based on the imbalance of radiated thermal and absorbed
solar radiation at the surface in the first run (too high a deep temperature
raises the mean surface temperature and thus gives an imbalance in absorbed
and re-radiated energy at the surface). As a result, thermal balance at
the surface on the second run was always excellent, equivalent to an error
in mean surface temperature of less than 0.05oK.
Parameterization
If x is replaced with X, defined as x/s, (i.e. if
depth is measured as the number of skindepths below the surface), and
K, $\rho$ and c are assumed constant with x, then Equation
22 simplifies to
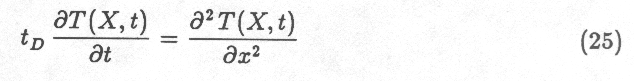
and 23 becomes
All the physical parameters are combined into one, $\sqrt{K\rho c}$,
the thermal inertia, which is the sole determiner of surface temperature
for a given albedo, insolation and rotation rate and a vertically-homogeneous
surface. I solved the equations in this form, with thermal inertia, length
of day, albedo, and latitude (which contributes a cosine factor to FS)
as the input parameters
Numerical Solution
For the vertically-homogeneous case, I divided the subsurface into 32 `slabs',
each with an X-thickness \delta X of 0.1 (to give 3.2 skindepths
total), and calculated the heat flow from each slab to the next over successive
time increments $\delta t$ using the `discrete' equivalent of equation
25, i.e.
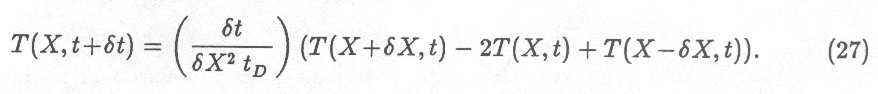
I obtained surface temperature from
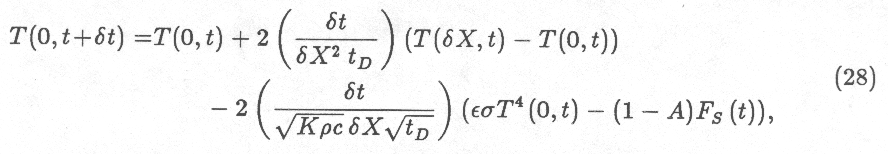
which is adapted from Equation 23 in a non-obvious manner (see Carnahan
et
al (1969) for details). I chose the fewest number of timesteps that
gave a stable numerical solution: typically this was around 600 timesteps
per rotation ($\delta t = tD /600$). Using smaller values
of $\delta X$ and $\delta t$ did not change the solution significantly.
As stated above, I ran each model twice to determine the correct deep
temperature. Each run started at midnight with uniform temperature with
depth, and continued for 4 rotations until the diurnal temperatures stabilized
and `forgot' the initial conditions. The surface temperatures on the final
rotation of the second run constituted the solution to the thermal model.
2 Layer Models
The above discussion refers to vertically-homogeneous models, but I also
ran models with a low thermal inertia layer overlying a higher thermal
inertia substrate. For a 2-layer surface there are three physical parameters
rather than one: the thermal inertias of the two layers and the thickness
of the top layer, expressed as a heat capacity per unit area ($\rho c
xt, where xt is the top-layer thickness).
Calculation of surface temperatures is similar to that for the homogeneous
case, except that the top layer is divided into a fixed number of slabs,
usually 6, while the lower layer temperatures are calculated with $\delta
X=0.1$ as before. For most 2-layer runs this gave top-layer slabs much
thinner than for the homogeneous case, necessitating up to 30,000 timesteps
per rotation for stability in some cases.
Eclipse Thermal Models
The physics of the eclipse modelling is identical to that for the diurnal
modelling described above, except that the insolation FS(t),
instead of varying smoothly during the day, drops rapidly to zero from
some `normal' daytime value, stays there awhile, and then sharply recovers
to something like its pre-eclipse value, as the sun is eclipsed by Jupiter.
Most of the complexities of the eclipse modelling involve calculating the
timing of the eclipses, and combining temperatures to get a disk-integrated
flux as a function of time. The procedure I employed was as follows:
1) I determined the pre-eclipse temperature profile
with depth at 52 points approximately evenly spaced across a projected
hemisphere of the satellite. To do this I ran a diurnal thermal model as
described above for the 6 latitudes 5.7o, 17.5o,
30.0o, 44.4o, 58.2o,
and 71.8o (sin-1 0.1, 0.3, 0.5, 0.7, 0.85, and 0.95
respectively). I recorded the temperature profile at various times during
each diurnal run: specifically 12, 12, 10, 8, 6, and 4 times for successively
higher-latitude bands. The times chosen were symmetric about the noon meridian
and approximately evenly spaced across the projected hemisphere (Fig.
44).
2) For each of these 52 locations I interpolated
the temperature profile, if necessary, to give slabs that were as thin
as the skindepth for a time of 1.5 X 10⁻⁴ satellite days.
Such thin slabs were necessary in order to accurately track the response
to the change in sunlight at the beginning and end of the eclipse, as in
a central eclipse the sunlight fades and returns at each point over a timespan
of 2.9 X 10⁻⁴ satellite days, due to the finite angular
diameter of the sun.
3) I used the interpolated temperature profile at
each point as the starting point for a thermal model (using Equations 27
and 28) in which the insolation FS(t) immediately began
to fade, remained at zero for the duration of the eclipse, and then returned.
I generally ran this eclipse model with higher time resolution than the
diurnal model, with a timestep $\delta t$ no larger than 6 X10⁻⁵ satellite
days. I modelled the fading and return of the sunlight on the assumption
that the sun was a uniform-brightness disk being occulted by a straight
edge: sunlight scattered in the Jovian atmosphere was ignored, as justified
by the photometric eclipse observations of Price and Hall (1971). I continued
the model after the eclipse for a time equal to the eclipse duration. The
52 surface temperature vs. time curves were stored.
4) I combined the 52 temperature curves with a program
that weighted each curve by its projected area (which varied as the satellite
rotated) as seen at zero solar phase angle, and offset them in time to
simulate the passage of Jupiter's shadow across the satellite disk. See
Fig. 44, which reproduces a screen output from
this program, showing the temperature at each of the 52 points over the
hemisphere as the satellite begins to enter Jupiter's shadow. For each
timestep, I determined the disk-integrated radiance in the 10- and 20\dmic\
filter passbands given in Hansen (1972).
This model is thus very detailed, and probably suffers from overkill
in several respects. Less than 52 surface regions would probably have been
sufficient, for instance (experiments with 74 regions gave essentially
the same results as 52). However the program results have shown that the
use of a realistic pre-eclipse temperature/depth profile is very important
in some circumstances, and previous models that have assumed isothermal
pre-eclipse conditions have been inaccurate. See Chapter 7.
Limitations of the Eclipse Model
The current program cannot model non-central eclipses, where Jupiter's
shadow crosses the satellite obliquely. This would require consideration
of both hemispheres of the satellite. In the 20\dmic\ Ganymede eclipse
matched in Figure 25 of Chapter 7, for instance,
Jupiter's shadow crossed Ganymede at an angle 52o from Ganymede's
spin axis, and the Callisto eclipse the corresponding angle was 68o.
I simulated an oblique eclipse by increasing the satellite diameter and
penumbra width so that the time taken for the satellite to cross the penumbra
was correct even though I was assuming parallelism of the shadow and spin
axis.
In calculating the disk-integrated emission I assumed that the Earth-based
observations were taken at zero solar phase angle. The true phase angle
of the Callisto event that I modelled was 8.5o, with the morning
hemisphere being preferentially in view. However, the Ganymede data I attempted
to fit came from 3 separate events with different phase angles, and the
scatter of the Ganymede data (Figure 25), is small enough that phase effects
do not seem to be too important.
Beaming (Appendix A) is ignored in my model.
This may be a serious limitation: until we understand beaming fully we
cannot predict how it might vary during eclipse. This is probably the largest
inadequacy of the present eclipse modelling and will be very difficult
to correct, though a better description of the beaming on the Galilean
satellites would help in estimating the size of the problem.
The subsurface penetration of sunlight, which is likely on icy surfaces
and results in something akin to an increased thermal inertia (Brown and
Matson 1987), is another missing element, but one that would be easier
to include than beaming.