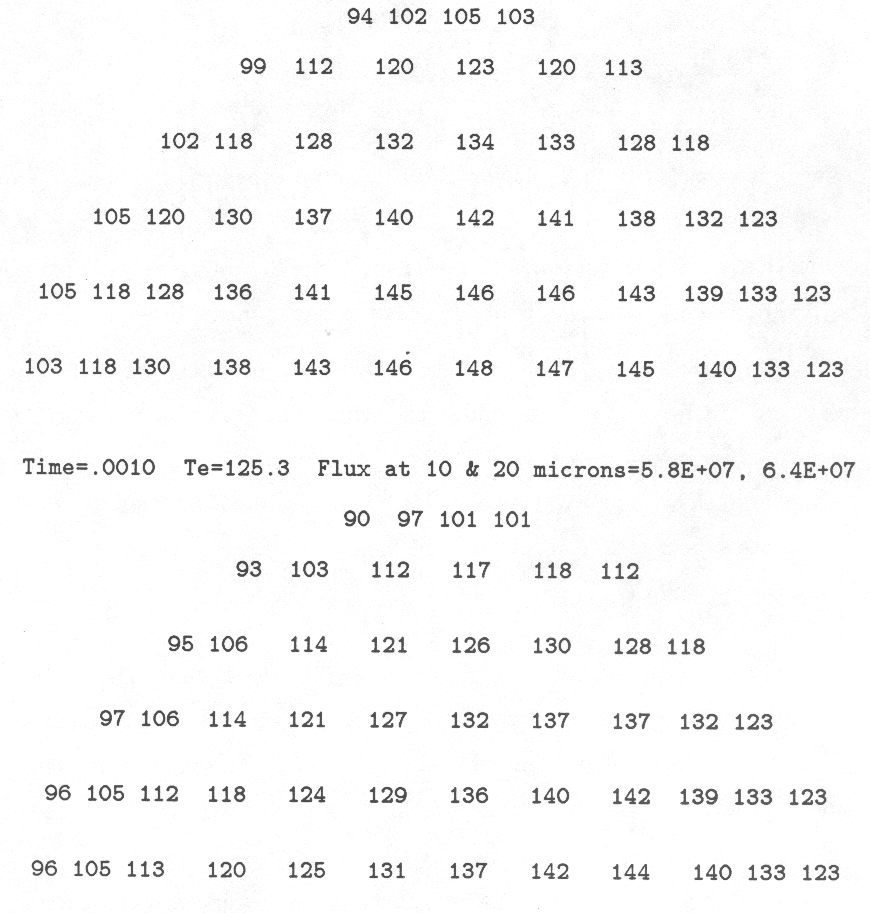
Fig. 44. Illustration of the Eclipse Thermal Model \fc Screen output from the eclipse program, showing surface temperatures over a hemisphere of Ganymede (using the best fit 2-layer thermal parameters of Chapter 7) prior to and during entry into Jupiter's shadow. Location of the numbers corresponds approximately to the position of the 52 points on the projected hemisphere. The right-hand portion of the hemisphere is still in full sunlight in the second plot. The data line refers to time in fractions of a Ganymede day, disk-integrated effective temperature, and disk-integrated 10 and 20\dmic\ broadband fluxes in arbitrary units.