|
These maps accompany the above referenced paper: "Searching for the Source
Regions of Martian Meteorites using MGS TES: Integrating Martian Meteorites
into the Global Distribution of Igneous Materials on Mars"
by V. E. Hamilton, P. R. Christensen, H. Y. McSween, Jr., and J. L. Bandfield
A description of microphonic noise in
TES data includes figures that were not shown in the article and provides
some additional information.
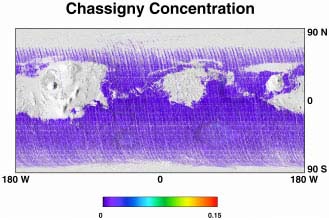
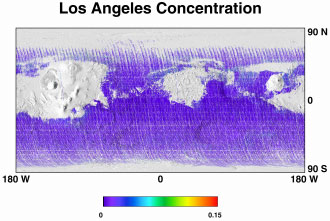
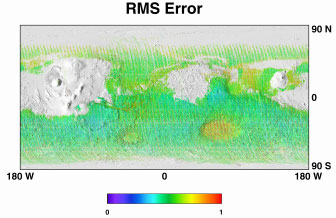
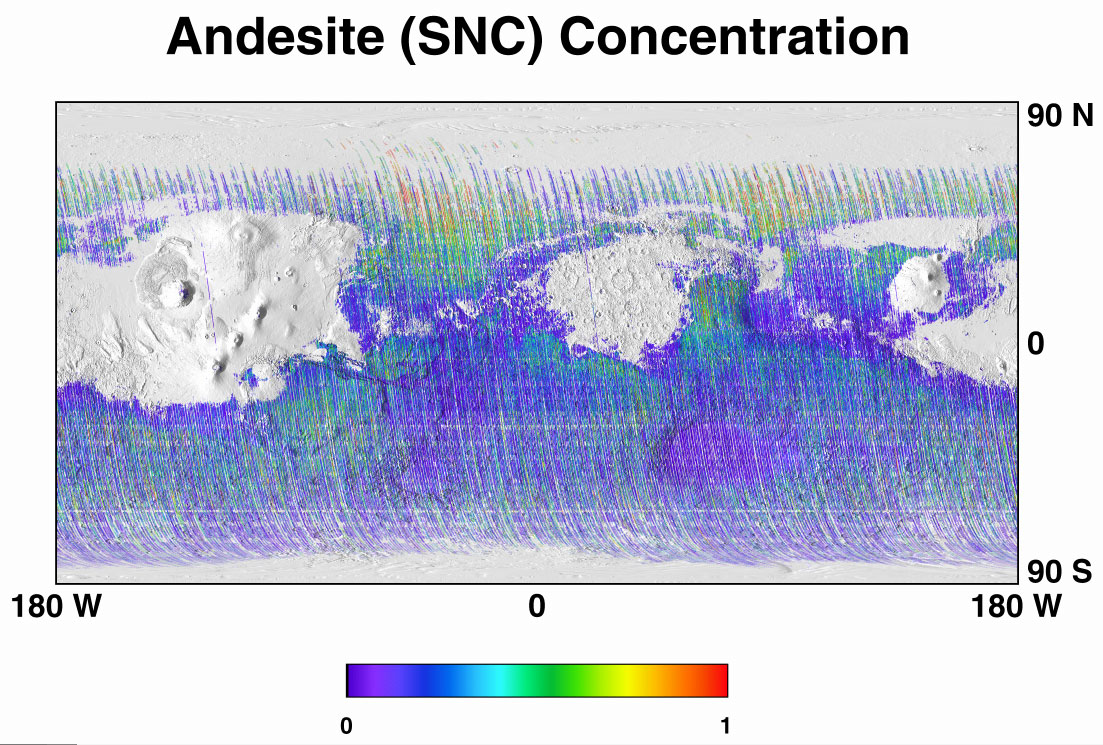
The following maps are scaled versions of 16 pixel per degree (ppd) maps
of the derived concentrations of end member materials used in a linear deconvolution
of the TES data set from OCK 1583 - 9500. An RMS error map is also shown.
The meteorite end member maps are provided in two compressed versions (~260k or 11-16 MB)
of the full-scale 16 ppd maps, which are ~90MB in size.
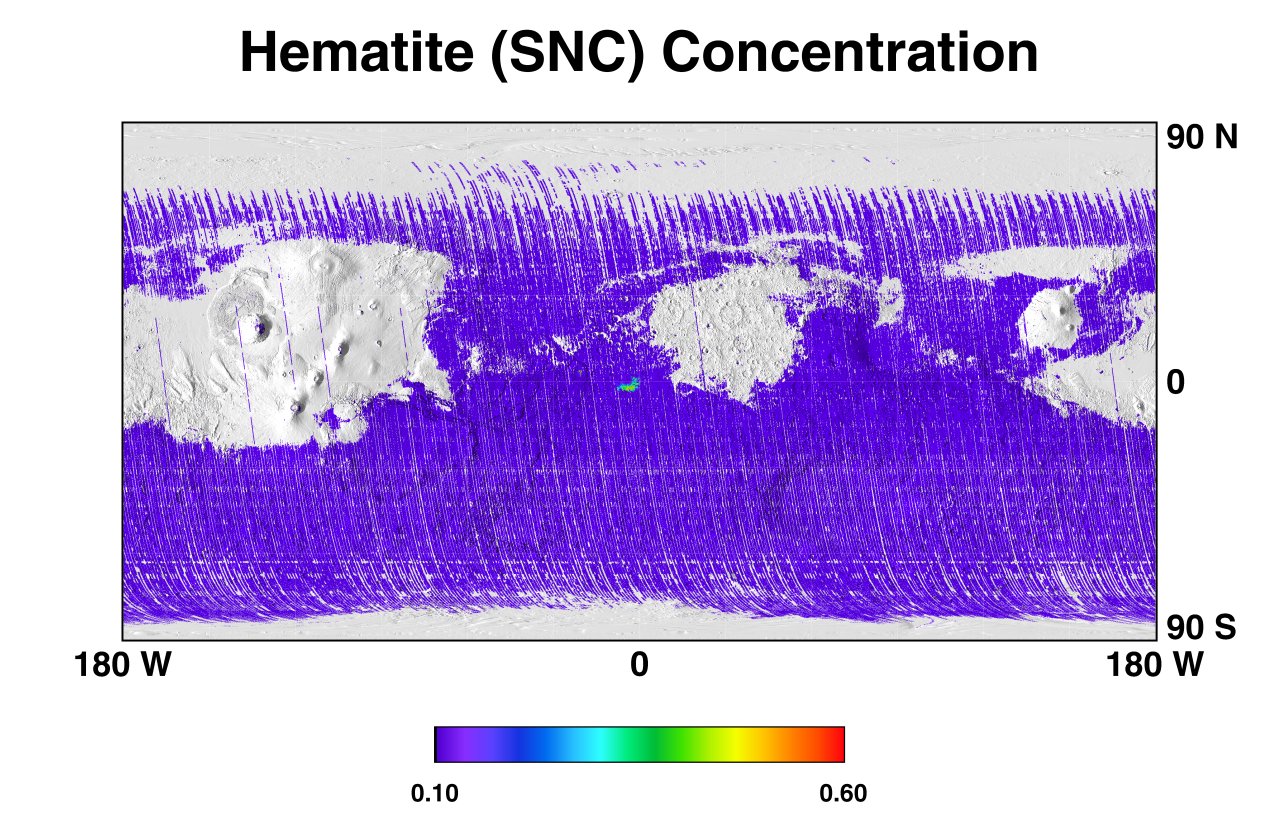
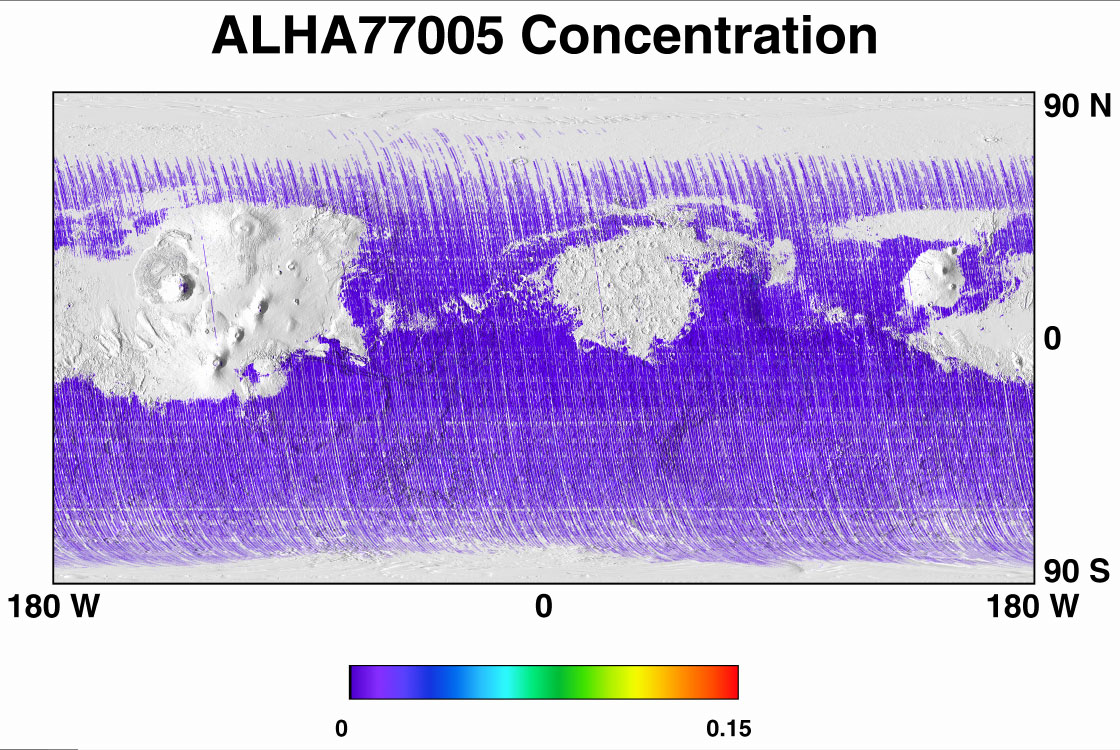
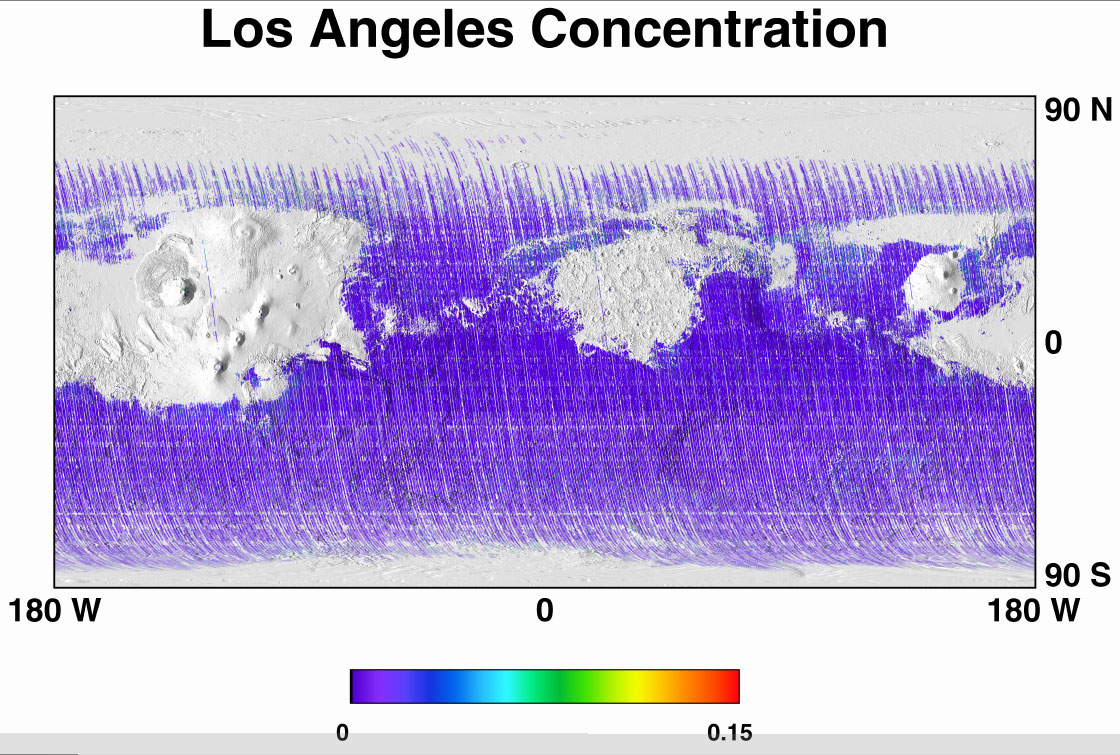
PLEASE NOTE: Although maps are titled "'Meteorite X' Concentration",
this is not meant to imply that these are maps of these meteorites' sources, but merely
that these are maps of TES spectra with spectral components LIKE those of
the Martian meteorites. The Martian materials identified in these maps
are not necessarily "Martian meteorite" material.
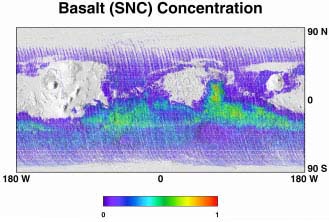
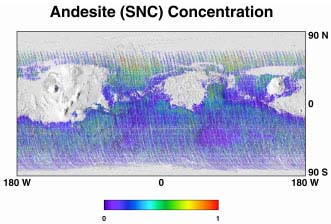
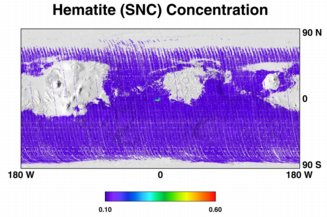
- With the exception of the RMS error map, the scalebar on each end member
image shows the concentration of each meteorite or surface composition
that was included in the best fit model to the spectra. Concentration is
defined as the fractional contribution to the total spectral
signal, which includes atmospheric components. Concentrations are not
necessarily representative of surface abundances, which are defined as
the fraction of surface material that is modeled by the end member,
and commonly are higher than concentrations. The concentrations shown here
may vary for several reasons, including: variable amounts of surface dust
within pixels, differences in particle size, and differences in abundance.
- Concentrations of less than ~0.10 generally are considered to be below the
detection limits of the TES instrument. Because different minerals/lithologies
may have slightly different detection values, only upon manual inspection of the
data have values below this threshold been shown to be true detections. Please
see the manuscript for further information on detections of meteorite-like
materials below concentrations of 0.10.
- All maps are overlaid on MOLA 16 ppd shaded relief. Areas
of high (>0.24) Lambert albedo are not mapped due to surface-obscuring dust.
The data have not been interpolated, so data gaps may be visible in
some locations.
- The titles on the maps of basalt, andesite, and hematite concentration
are somewhat confusing - "Basalt (SNC) Concentration" means that the map is
of the TES basaltic surface type (i.e., not a meteorite) concentration,
but as derived in this (SNC) study. These maps are virtually
identical to the maps of these components produced by Bandfield et al. [2000]
and Christensen et al. [2001].
- Finally, these images are the original property of
Victoria E. Hamilton, and are copyrighted by the Meteoritical Society. They
may not be used (in print, digital, or other form) without the express permission
of the Meteoritical Society and the author. You may link to this page, but please
do not create links to the images themselves. If you have any questions about the
maps or how they were created, or if you wish to use one or more of
these images for personal, public, or other use, please contact me at
hamilton@boulder.swri.edu.
|


